UW-Stout/Heat Shock SP22
Contents
Introduction
A heat shock experiment tests a cell's ability to hold up and survive extreme temperature swings. If one of the 9 genetically modified S. Cerevisiae yeast cells holds up better to a heat shock experiment than the wild type, there are many cases where this is beneficial. The cells are shocked in a thermocycler and then measured using a flow cytometer to measure the percent dead and alive.
Materials
- Cultured Genetically Modified Yeast Cells in Solution
- Phosphate buffered saline (PBS) solution.
- Propidium Iodide (100 μg per ml)
Equipment
- Hemocytometer
- Flow cytometer
- Microscope
- 1.7 ml centrifuge tubes
- 200 μl PCR tubes
- P-1000, P-200, P-20, and P-10 Micropipettes and accompanying tips
Calibrartion Experiment
Diluting the Yeast Cell Solution
- Vortex the tube of control yeast cells (BY4735), then immediately pipet 500 μl of the cells into a 1.7 ml centrifuge tube.
- Set up the hemocytometer.
- Count the number of cells in the big square in the top left corner.
- Use a calculator to figure out the volume of the cell solution needed to make a 1 ml solution of 200 cells per μl.
- Vortex the cell solution, then immediately pipet that volume into a 1.7 ml centrifuge tube.
- Pipet the rest of the volume with PBS to make a 1 ml solution.
- Vortex the new cell solution to distribute the cells.
- Label that tube with a checkmark.
Heat Shocking the Yeast Cells
- Set a thermocycler to an incubate cycle with the base at 50 C and the lid at 55 C.
- Set out 6 PCR tubes onto a PCR tube rack.
- Label the first tube 1, second 2, third 5, fourth 10, fifth 20, and sixth 40.
- Vortex the cells in the tube with the checkmark and then immediately pipet 100 μl of the solution into each of the PCR tubes.
- Put the six PCR tubes into the thermocycler and set a timer for 40 minutes.
- Take the PCR tubes out of the thermocycler after each of their times are up.
- 1 tube out after 1 minute, 2 tube out after 2 minutes, etc.
- Allow the cells to cool.
Testing the Cells
- Set out 7 1.7 ml centrifuge tubes.
- Label one with the number 0 and the other six with the times for the PCR tubes.
- Vortex the checkmark tube and immediately pipet 100 μl of the cell solution into the centrifuge tube labeled 0.
- Vortex one of the PCR tubes and immediately pipet 110 μl of cell solution and place it into the centrifuge tube labeled with the corresponding time number.
- The P-200 should be set to 110 μl even though there is only 100 μl of the solution to ensure that all of the liquid is gathered.
- Repeat step 4 for the other PCR tubes.
- Add 6 μl of propidium iodide to each of the centrifuge tubes.
- Vortex all of the tubes to distribute the propidium iodide.
- Follow standard protocol for starting up the flow cytometer.
- Set the machine settings to the following
- FSC, SSC: 15 (low sensitivity)
- GRN: 8, YEL: 8, RED: 8 (low sensitivity)
- 5-decade acquisition
- 5000 events
- Flow rate medium
- Set the graph plots to
- Plot 1: FSC-Log/SSC-Log
- Plot 2: GRN-Log/RED-Log
- Plot 3 (hist): RED-Log
- Vortex the 0 tube and load it into the flow cytometer.
- Run the flow cytometer.
- Run the rest of the tubes in the flow cytometer.
Gathering the Data
- Click on one of the 0 controls.
- Make a polygonal region around the clump of black dots on the graph on the top left.
- Apply that gate to the bottom right graph by clicking and dragging the name from the top-left graph to the bottom right graph.
- Make a new histogram region on the bottom right graph that expands the entire width of the curve.
- Create a new stat for that region.
- Select count and percentage.
- Record the data in a table and dispose of the tube.
Results
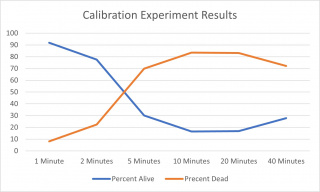
The calibration experiment ended up being a decent success. The flow cytometer ate all of the control that we had so we didn't have data for a control point. The percentages Dead/Alive leveled off at ten minutes. We found it weird that the 20-minute and 40-minute experiments were found to have a lower percentage dead than the 10-minute experiment. We settled on keeping the tubes in the thermocycler for 5 minutes. We chose this time because it was a pretty good middle ground for the experiment.


Final Protocol Instructions
Diluting the Yeast Cell Solution
- Vortex the tube of cultured yeast cells, then immediately pipet 500 μl of the cells into a 1.7 ml centrifuge tube.
- Set up the hemocytometer.
- Count the number of cells in the big square in the top left corner.
- Use a calculator to figure out the volume of the cell solution needed to make a 1 ml solution of 200 cells per μl.
- Vortex the cell solution, then immediately pipet that volume into a 1.7 ml centrifuge tube.
- Pipet the rest of the volume with PBS to make a 1 ml solution.
- Vortex the new cell solution to distribute the cells.
- Label that tube with a checkmark.
Heat Shocking the Yeast Cells
- Set a thermocycler to an incubate cycle with the base at 50 C and the lid at 55 C.
- Set out 3 PCR tubes onto a PCR tube rack.
- Label the tops of the tubes with the number 5.
- Vortex the cells in the tube with the checkmark and then immediately pipet 100 μl of the solution into each of the PCR tubes.
- Put the three PCR tubes into the thermocycler and set a timer for 5 minutes.
- Take the PCR tubes out of the thermocycler after the 5 minutes are up.
- Allow the cells to cool.
Testing the Cells
- Set out six 1.7 ml centrifuge tubes.
- Label three with the number 0 and the other three with the number 5.
- Vortex the checkmark tube and immediately pipet 100 μl of the cell solution into the centrifuge tubes labeled 0.
- Vortex one of the PCR tubes and immediately pipet 110 μl of cell solution and place it into one of the centrifuge tubes labeled 5.
- The P-200 should be set to 110 μl even though there is only 100 μl of the solution to ensure that all of the liquid is gathered.
- Repeat step 4 for the other two PCR tubes.
- Add 6 μl of propidium iodide to each of the centrifuge tubes.
- Vortex all of the tubes to distribute the propidium iodide.
- Follow standard protocol for starting up the flow cytometer.
- Set the machine settings to the following
- FSC, SSC: 15 (low sensitivity)
- GRN: 8, YEL: 8, RED: 8 (low sensitivity)
- 5-decade acquisition
- 5000 events
- Flow rate medium
- Set the graph plots to
- Plot 1: FSC-Log/SSC-Log
- Plot 2: GRN-Log/RED-Log
- Plot 3 (hist): RED-Log
- Vortex one of the 0 tubes and load it into the flow cytometer.
- Run the flow cytometer.
- Run the rest of the tubes in the flow cytometer.
Gathering the Data
- Click on one of the 0 controls.
- Make a polygonal region around the clump of black dots on the graph on the top left.
- Apply that gate to the bottom right graph by clicking and dragging the name from the top-left graph to the bottom right graph.
- Make a new histogram region on the bottom right graph that expands the entire width of the curve.
- Create a new stat for that region.
- Select count and percentage.
- Record the data in a table and dispose of the tube.
Results
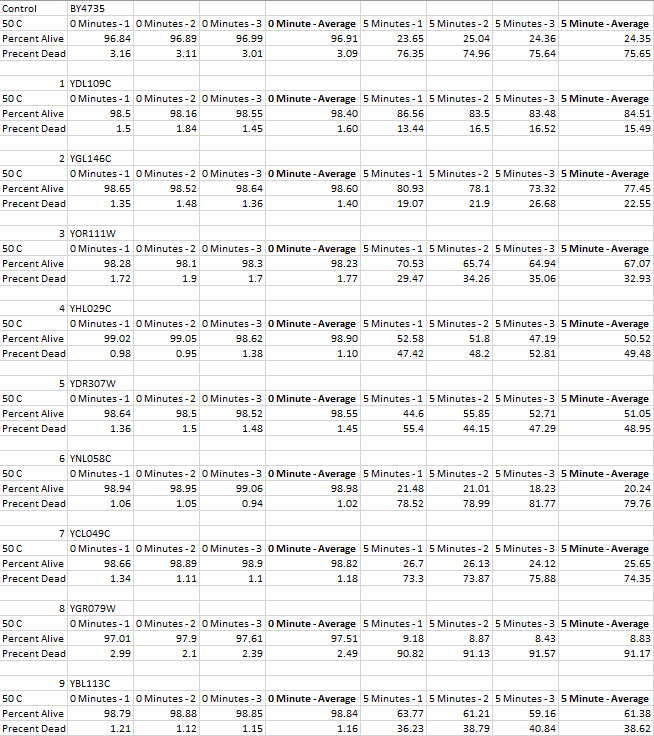
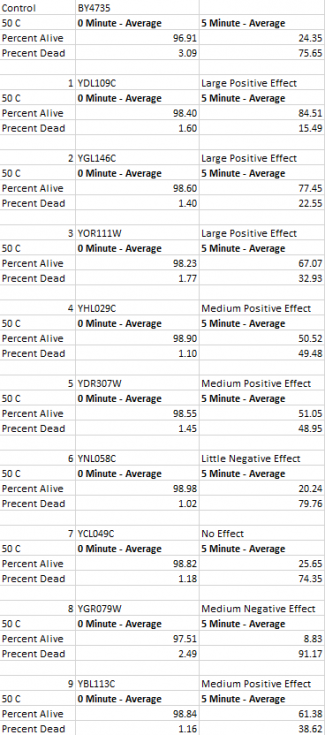
These are the results that we found from the experiment. All but one gene affected how well the cell survived during heat shock. We found that most cells actually survived in greater masses with the genes knocked out.

