YDR307W
Share your knowledge...Edit this entry! <protect>
| Systematic name | YDR307W |
| Gene name | PMT7 |
| Aliases | |
| Feature type | ORF, Uncharacterized |
| Coordinates | Chr IV:1075865..1077853 |
| Primary SGDID | S000002715 |
Description of YDR307W: Putative protein mannosyltransferase similar to Pmt1p; has a potential role in protein O-glycosylation[1]
</protect>
Contents
- 1 Community Commentary
- 2 References
Community Commentary
About Community Commentary. Please share your knowledge!
This gene is part of the UW-Stout Orphan Gene Project. Learn more here.
UW Stout/D2O SP22
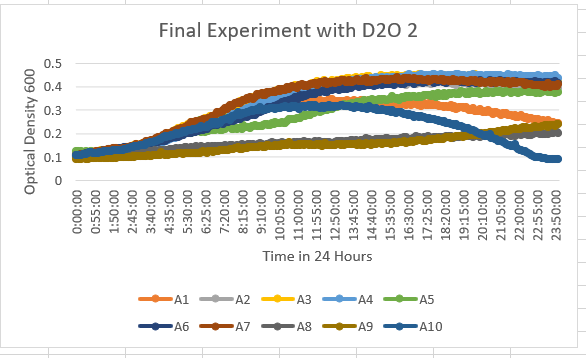
The YDR307W Knock Out Yeast Strain is A5 and is fairly unaffected by the 35% dilution of D2O, however, has a slight sensitivity to the dilution. With the maximum value ranging along the lines of 0.4-0.5 OD 600.
UW Stout/Sucrose Fermentation SP22
| Gene | Glucose | Fructose | Ethanol |
| Standard solution | 2.0000 | 0.2000 | 2.0000 |
| YDl109C | 0.3800 | 0.3933 | 0.3430 |
| YGL140C | 0.2212 | 0.2685 | 0.1867 |
| YOR111W | 0.3332 | 0.3598 | 0.1343 |
| YHL029C | 0.3870 | 0.2368 | 0.1151 |
| YDR307W | 0.4366 | 0.2487 | 0.0606 |
| YNL058C | 0.2710 | 0.3056 | 0.1577 |
| YCL049C | 0.4078 | 0.3052 | 0.1969 |
| YGR079W | 0.4042 | 0.1589 | 0.0080 |
| YBL113C | 0.3498 | 0.2012 | 0.1434 |
| BY4735 | 0.3171 | 0.3084 | 0.3541 |
Interpretation
This gene produced 17.11% of the amount of ethanol that the wild type produced. It is possible that this gene plays a role in fermentation because of such a low amount of ethanol production.
<protect>
UW-Stout/UV Light SP22
As part of the University of Wisconsin Stout Orphan Gene Project this gene was tested under a UV Light using this protocol.
RESULTS
INTERPERTATION
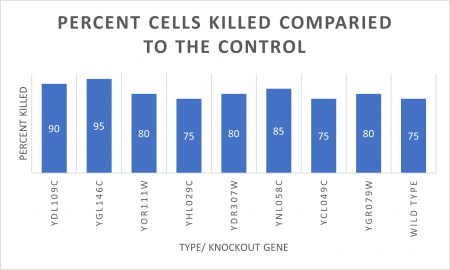
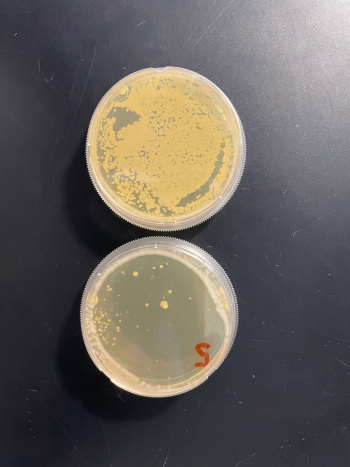
In the graph and photos above, exposing this gene to 600 seconds of 400 Watt UV Light killed approximately 80% of yeast cell cultures, compared to its control counterpart, which was the same gene and amount of cells, just was not exposed to UV Light.
UW-Stout/Heat Shock SP22
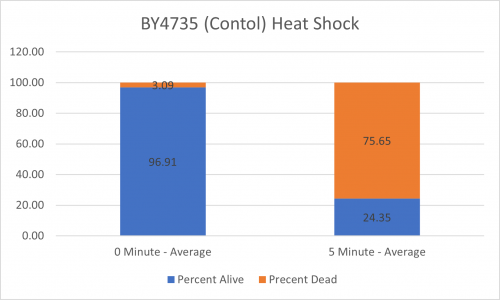
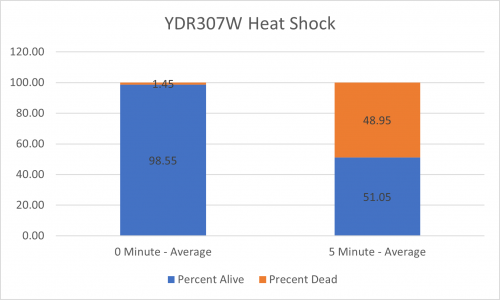
As part of the University of Wisconsin Stout Orphan Gene Project this gene was tested by exposing the cells to heat shock.
Results
Interpretation
From the data gathered, there was a medium positive effect to knocking out this gene when it came to the yeast's ability to hold up to heat shock. The modified yeast cells were 210% more resistant to heat shock than the control.
UW-Stout/Caffeine SP22
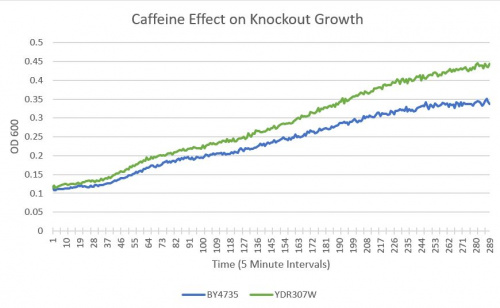
As part of the University of Wisconsin Stout Orphan Gene Project this gene was tested by exposing the cells to 4mM of caffeine following this protocol.
Results
- BY4735(wild type yeast) and YDR307W(knockout yeast gene) growth after being subjected to 4mM caffeine solution.
Interpretation
As can be seen in the growth curve, YDR307W shows a similar response to caffeine as the Wild-Type yeast, however, YDR307W is more resistant to caffeine. Optical Density 600 measures this as a difference of 36%.
UW-Stout/Hydrogen Peroxide SP22
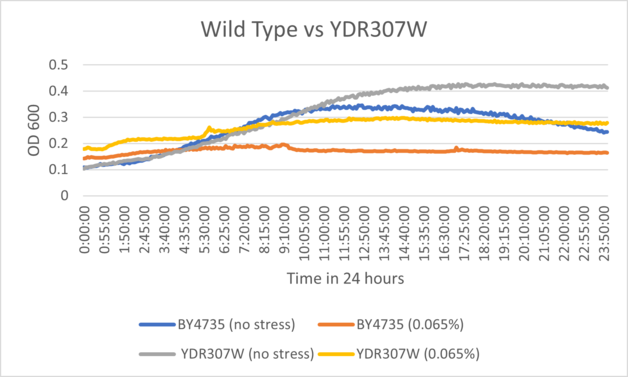
As part of the University of Wisconsin Stout Orphan Gene Project this gene was tested by exposing the cells to hydrogen peroxide.
Results
BY4735 and YDR307W after being exposed to 0.065% dilution of hydrogen peroxide solution.
Interpretation
YDR307W displayed mild sensitivity to hydrogen peroxide within the growth curve, but it's inhibition range was slightly smaller than wild type cells treated with the same solution. This could be a difference in growth celling or that the knockout has caused a slightly lessened sensitivity to the stress factor.
UW Stout/Nystatin SP22
As part of the University of Wisconsin Stout Orphan Gene Project this gene was tested by exposing the cells to 1µg/ml Nystatin solution.
Results
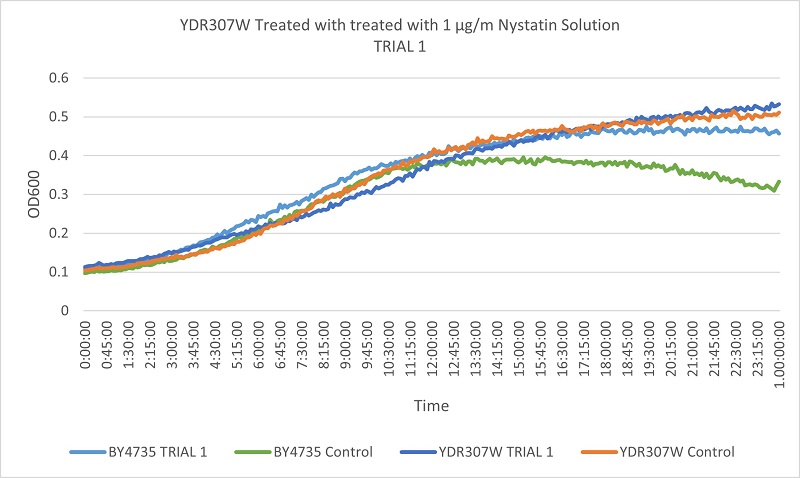
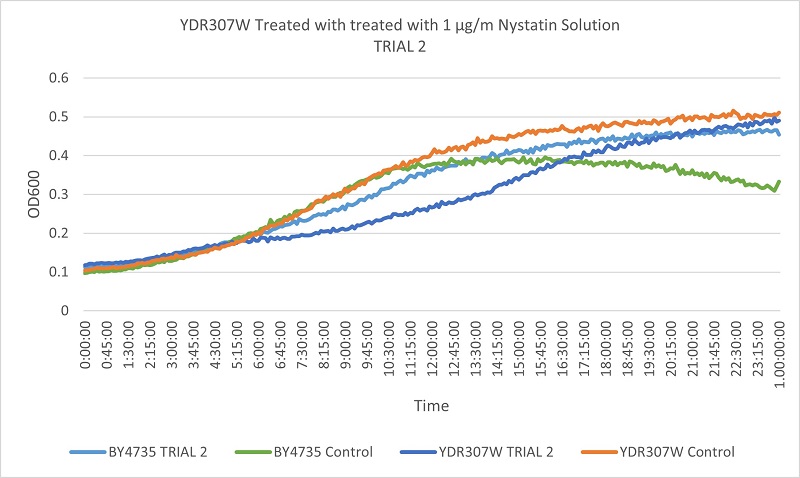 The growth rates of the wild type yeast cells and the YDR307W strain are very similar. The YDR307W strain is not consistently different from the wild type yeast under Nystatin treatment, indicating that the removal of the YDR307W gene does not effect its resistance to Nystatin.
UW-Stout/Formamide SP22
Results
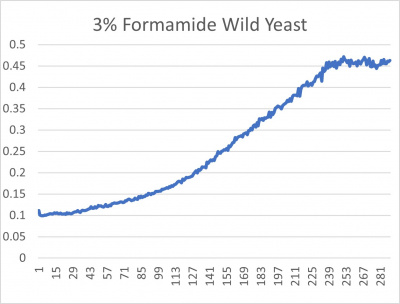
- 3% formamide line graph: x-axis= growing time (min); y-axis= optical density 600
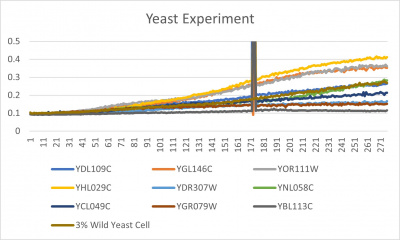
- Trial 2 line graph: x-axis= growing time (min); y-axis= optical density 600; key= yeast strains and corresponding color to the individual lines in the line graph
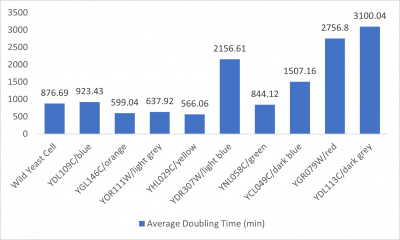
- Average doubling time bar graph: x-axis= yeast strains and corresponding colors to the trial 2 line graph; y-axis= average doubling time (min)
Interpretation
The wild yeast cell treated with 3% formamide had a doubling time of 876.69 min. The 3% formamide solution added to nine transformed yeast cells was then compared to the wild yeast cell using the computed doubling times to see the effects of the formamide. In the experiment, some of the transformed yeast cells were heavily effected by the formamide, including the YDR307W strain. The YDR307W strain had doubling times significantly slower than the wild yeast cell, with a doubling time of 2156.61 min. It can be concluded that the transformed yeast cell, YDR307W, had a unique response to the formamide stress test used in the experiment.
References
See Help:References on how to add references
See Help:Categories on how to add the wiki page for this gene to a Category </protect>
UW-Stout/Nonionic Detergent SP22
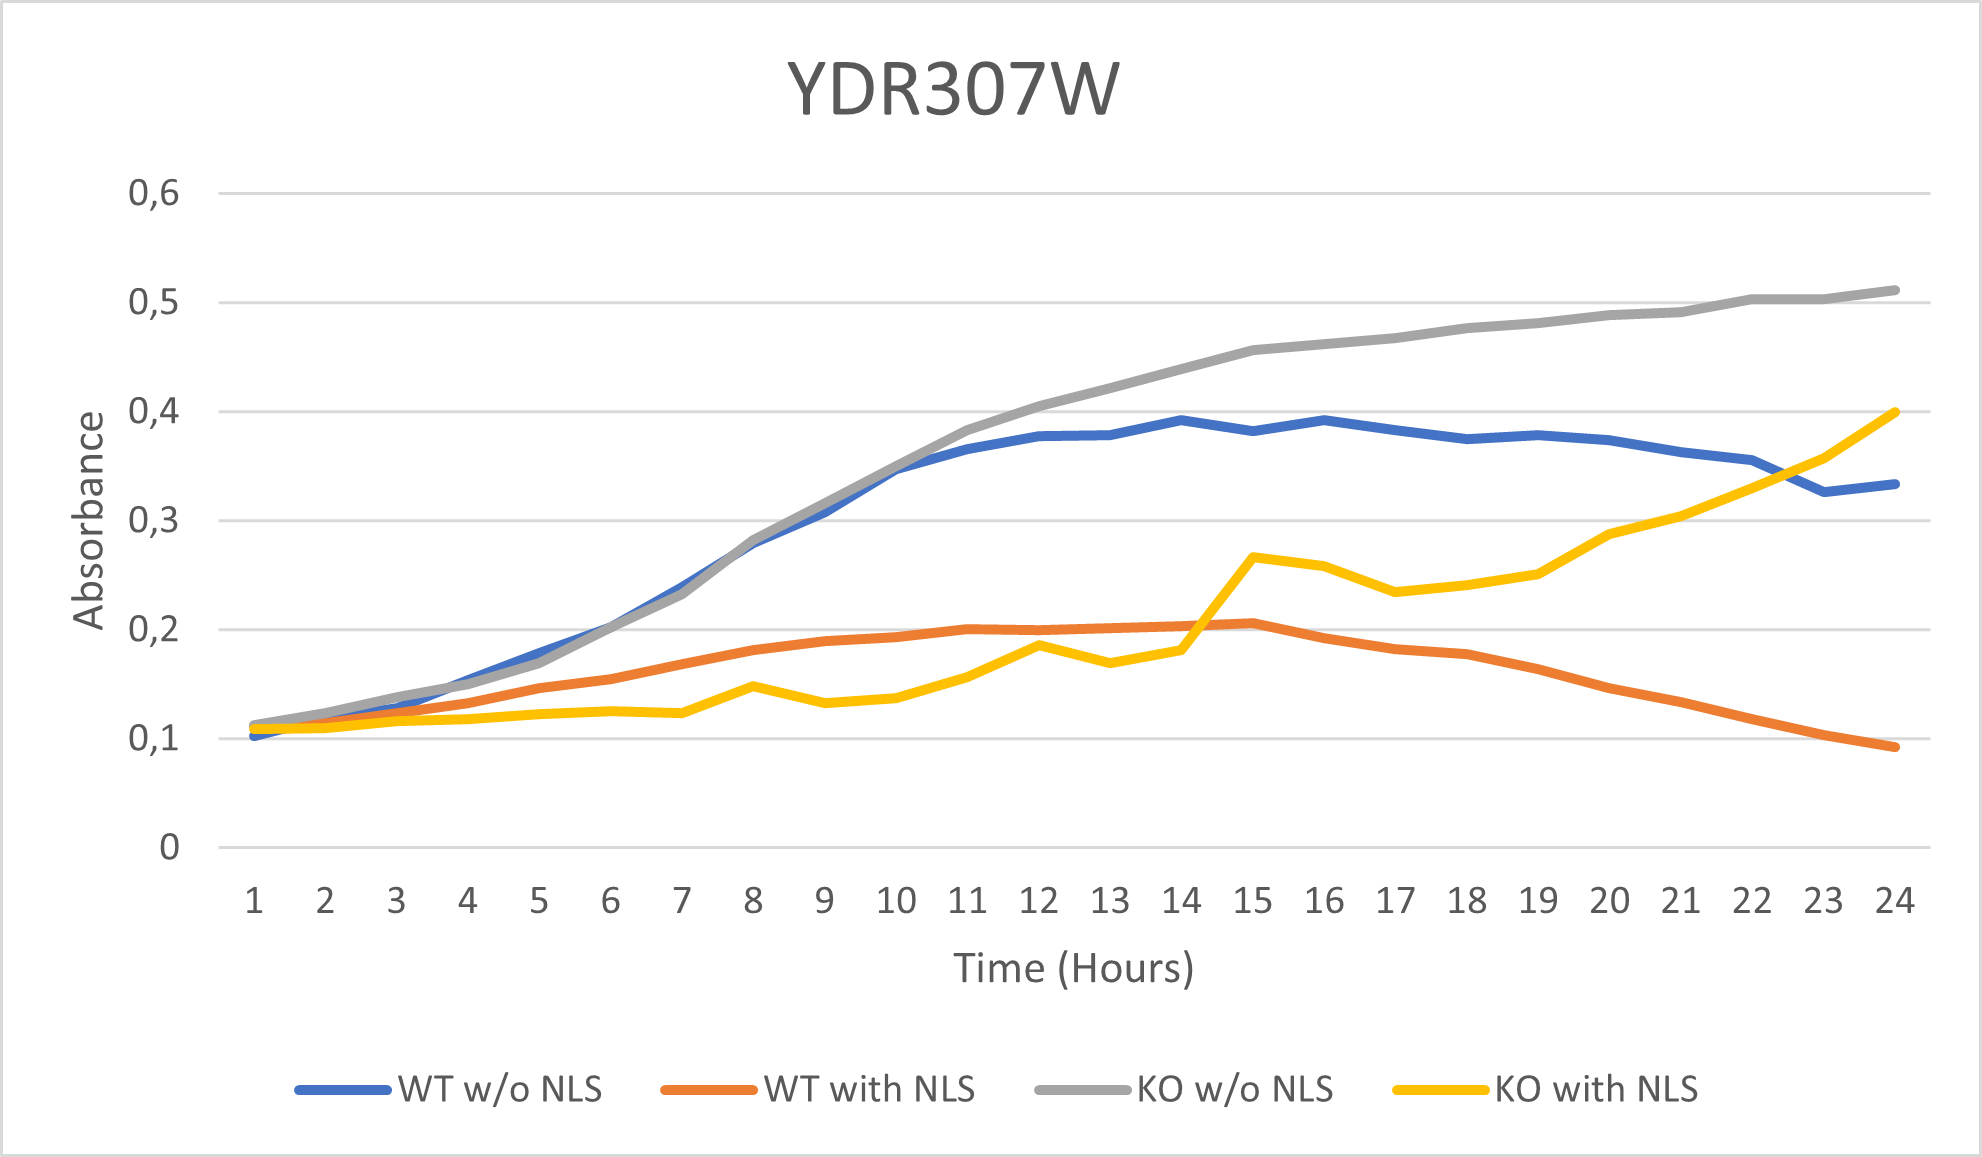
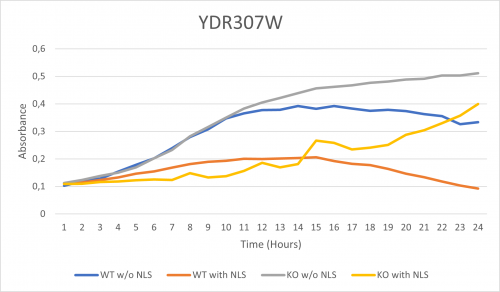
As part of the University of Wisconsin Stout Orphan Gene Project this gene was tested by exposing the cells to 0.001% concentrated NLS. (Nonionic detergent)
Interpretations:
-According to the graph above, we can see that the KO yeast cell YDR307W follow a smaller sensitivity to the stress than the Wild type strain. -We can then conclude that the knocked-out gene in YDR307W doesn't have a significant impact on the growth of the yeast cell.
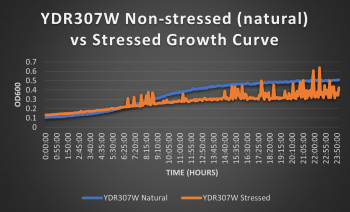 Knocked out gene seems to have very little effect on cell growth in pH 7 environment based on the flattening of the growth curve. Spikes in stressed line are to be ignored; they occurred due to clumping of cells during analysis. We are focusing on the general linear trend of the growth curve. Please see protocol for specific quantitative doubling time results.
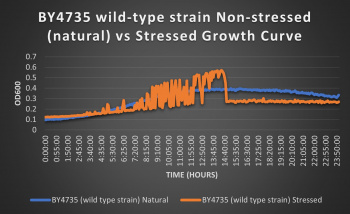 The wild-type strain was used as a control in this experiment; no genes were knocked out, it just represents how the experiment ran on the knocked-out gene strains affects a "typical" cell growth curve. Inclusion of this data on each knock-out strain growth curve graph made for difficult interpretation, so it has been separated. Please refer to this graph as a control when viewing the knock-out strain growth curve graph. Spikes in stressed line are to be ignored; they occurred due to clumping of cells during analysis. We are focusing on the general linear trend of the growth curve.
