Difference between revisions of "UW-Stout/Caffeine SP22"
(Created page with "'''Materials:''' • Caffeine • Sterile H2O • Wild-Type Yeast Cells • Modified Yeast Cells '''Equipment:''' • Large Test Tube • 1.7 ml Microcentrifuge Tube • 200...") |
|||
| (5 intermediate revisions by the same user not shown) | |||
| Line 38: | Line 38: | ||
|} | |} | ||
| − | [[Image: | + | [[Image:Stresstest1.jpeg]] |
As can be seen in the graph above, Well 1 (our control group) shows the expected growth curve. Every group with a concentration of at least 8mM showed little growth and can be assumed dead. Well 2, at 4mM, shows a reduction in growth but not a visible result for future tests. | As can be seen in the graph above, Well 1 (our control group) shows the expected growth curve. Every group with a concentration of at least 8mM showed little growth and can be assumed dead. Well 2, at 4mM, shows a reduction in growth but not a visible result for future tests. | ||
| Line 46: | Line 46: | ||
# Set Well Plates with 50 uL of each Yeast group of the following: | # Set Well Plates with 50 uL of each Yeast group of the following: | ||
## BY4735 | ## BY4735 | ||
| − | ## YDL109C | + | ## [[YDL109C]] |
| − | ## YGL140C | + | ## [[YGL140C]] |
| − | ## YOR111W | + | ## [[YOR111W]] |
| − | ## YHL029C | + | ## [[YHL029C]] |
| − | ## YDR307W | + | ## [[YDR307W]] |
| − | ## YNL058C | + | ## [[YNL058C]] |
| − | ## YCL049C | + | ## [[YCL049C]] |
| − | ## YGR079W | + | ## [[YGR079W]] |
| − | ## YBL113C | + | ## [[YBL113C]] |
# Add 50 uL of 4 mM Caffeine Solution to each Well. | # Add 50 uL of 4 mM Caffeine Solution to each Well. | ||
# Incubate | # Incubate | ||
Latest revision as of 17:39, 3 May 2022
Materials: • Caffeine • Sterile H2O • Wild-Type Yeast Cells • Modified Yeast Cells
Equipment: • Large Test Tube • 1.7 ml Microcentrifuge Tube • 200 ul Pipette • Micro Pipette Tips • Well Plates
Calibration Protocol:
- Create a 32 mM Solution of Caffeine in Sterile H2O.
- Set Well Plate with 50 ul of Wild-Type Yeast Cells and the following concentrations of Caffeine.
| Well 1 | Well 2 | Well 3 | Well 4 | Well 5 | Well 6 | Well 7 | Well 8 | |
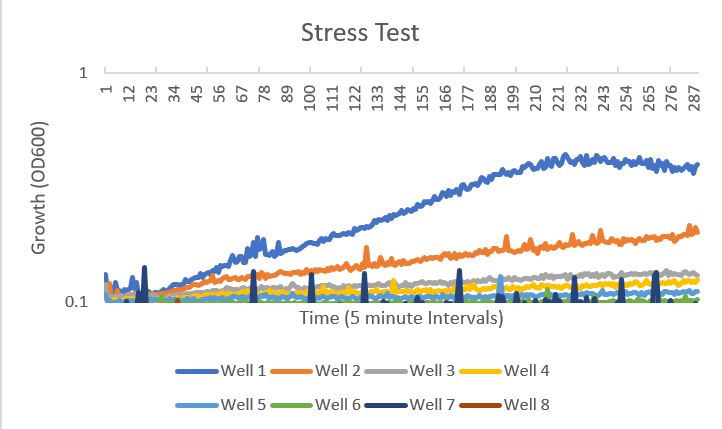
| Caffeine Concentration | 0 mM | 4 mM | 8 mM | 12 mM | 16 mM | 20 mM | 28 mM | 32 mM |
As can be seen in the graph above, Well 1 (our control group) shows the expected growth curve. Every group with a concentration of at least 8mM showed little growth and can be assumed dead. Well 2, at 4mM, shows a reduction in growth but not a visible result for future tests.
Knockout Protocol:
