Combined Physical and Genetic Maps of S. cerevisiae
This page contains links to combined physical and genetic maps for each of the sixteen nuclear chromosomes. In each of these maps genetically and physically mapped features are displayed in a side-by-side representation based on the physical and genetic distances between genes and loci respectively. This page also contains graphs for each of the nuclear chromosomes where relative recombination frequencies along the chromosome are represented based on the ratios of genetic to physical distance, using both two-point data and the lengths of DNA sequences in the genome.
Two-point genetic mapping data can be accessed on the downloads site in a file named genetic_map.tab. Details of the file contents can be accessed in the associated README file.
Combined Physical and Genetic Maps
The combined physical and genetic maps contain a side-by-side representation of the physical and genetic maps for the each nuclear chromosome, based on distances calculated from genetic and physical data. This data was derived from the systematic genomic sequencing project and from data contained within SGD (Cherry et al., Nature 387(6632S):67-73 (1997)), as well as data presented in earlier reviews Mortimer and Schild, Microbiol. Rev. 44:519-571 (1980), Microbiol. Rev. 49:181-213 (1985), Mortimer et al., Yeast 5:321-404 (1989), and Mortimer et al., Yeast 8:817-902 (1992)). In the case where an ORF has been defined, its standard gene name is indicated.
Click below on one of the sixteen chromosome numbers to display the Combined Physical and Genetic Map for a desired chromosome.
| I | II | III | IV | V | VI | VII | VIII | |
| IX | X | XI | XII | XIII | XIV | XV | XVI | |
| ||||||||
Organization of the Combined Physical and Genetic Maps
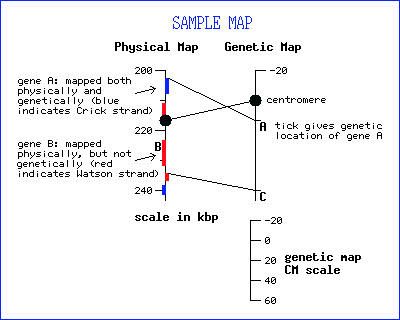
- Physical and Genetic Map positions - The Physical Map is presented on the left (in Kbp) and the Genetic Map on the right (in cM) side of each map. Correspondingly, the Kbp scale is displayed on the left side of the window and the cM scale on the right side.
- ORF Identification on the Physical Map - ORFs are identified by blue (Crick strand) and red (Watson strand) bars on the physical map. The boxes on the left of the physical map line are for ORFs which have been mapped physically, but not genetically (i.e. gene B in the display). The boxes to the right of the physical map line are for those ORFs which have been mapped both physically and genetically (i.e. genes A and C in the display).
- ORF Labeling - All identified ORFs are present as bars on the Combined Genetic and Physical Map. In the case where an ORF has been defined, its primary gene name is present on the map. ORFs without gene names are represented only by bars on the map.
- ORF Identification on the Genetic Map - ORFs are identified on the genetic map by horizontal tick marks to the right of the genetic map.
- Lines connecting the Physical and Genetic Maps - Lines connect genetically mapped genes with their ORFs on the physical map. In this case, the line extends from the top of the ORF's colored box on the physical map to the corresponding tick mark on the genetic map (see genes A and C for an example).
- Getting to the Locus Summary page - To get to the Locus Summary page for any of the ORFs displayed on the map, enter the name for the ORF in the search box located at the top of all SGD pages.
- Overlapping ORFs - In the case of overlapping ORFs, the element at the bottom is shown to overlap the element at the top.
Genetic Distance vs. Physical Distance Ratios
These graphs represent the length of a given chromosome along the x-axis (in kilobase pairs) and the ratio of centimorgans to kilobase pairs along the y-axis. Since the location in centimorgans is not known for every locus, intervals are graphed. For example, if marker A is 15 kilobase pairs away from its closest genetically mapped locus, marker B, there will be a 15 kilobase pair-long plateau with the cM/Kbp value that is calculated for that genetic interval.
Click below on one of the sixteen chromosome numbers to display the Genetic Distance vs. Physical Distance Ratio for a desired chromosome.
| Chromosome | I | II | III | IV | V | VI | VII | VIII | IX | X | XI | XII | XIII | XIV | XV | XVI |
| cM/Kbp | 0.45 | 0.30 | 0.48 | 0.31 | 0.35 | 0.48 | 0.37 | 0.30 | 0.45 | 0.30 | 0.38 | 0.36 | 0.34 | 0.37 | 0.33 | 0.29 |