YMR144W
Share your knowledge...Edit this entry! <protect>
| Systematic name | YMR144W |
| Gene name | |
| Aliases | |
| Feature type | ORF, Uncharacterized |
| Coordinates | Chr XIII:553362..554390 |
| Primary SGDID | S000004752 |
Description of YMR144W: Putative protein of unknown function; localized to the nucleus; YMR144W is not an essential gene[1][2]
</protect>
Contents
Acids
Analysis
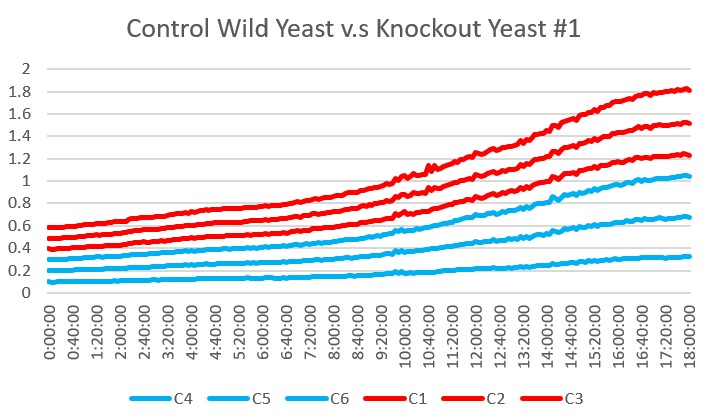
These are the results we gathered from testing a pH of # against the control wild yeast and the gene YMR144W. The three red lines are the growth rates of the BY (wild yeast) mixed with a pH of # and the three blue lines are the three growth rates of the YMR144W knockout gene mixed with a pH of #. All of the trials showed great growth rates. The average double time of the wild yeast was 13.57 minutes and the average double time of the YMR144W gene was 10.17 minutes. The YMR144W growth rates did grow at a slower rate compared to the wild yeast. All trials did demonstrate strong cell growth over the 18 hours.
Caffeine
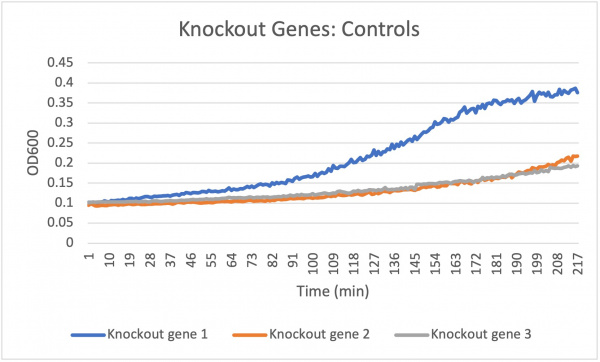
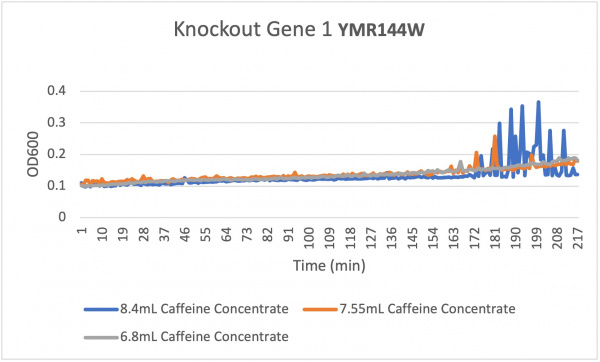
Analysis The average doubling time for the YMR144W gene in standard conditions was 194.2 minutes. Under the stress of the caffeine stress the average doubling time was 84 minutes. Under the stress of caffeine there was more growth that happened. This is interesting to think about because usually under some sort of stress there would be less growth. We are also able to see that there is staggered growth among the caffeine stress and that could be a cause of such high amounts of caffeine concentration. We also see that the lesser the concentration of caffeine the slower it grew as for the 6.8mL of caffeine concentration. We see that with more caffeine the knockout strain was still able to grow quite rapidly but with less caffeine stress it grew more slowly. We also see the spiked regions in our graphs indicating that there was a lot of growth during that time frame.
Isopropanol
Analysis
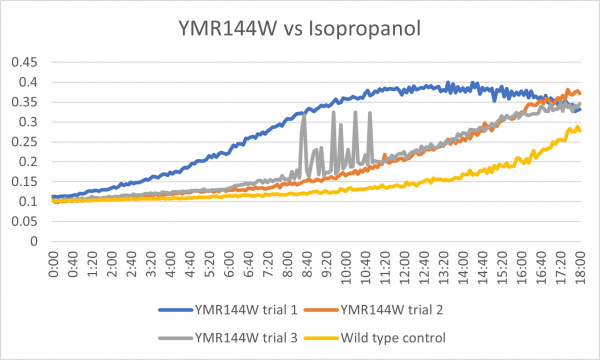
These results were not consistent as there are 3 very different results. The first trial was way off what it was supposed to be and therefore could have been contaminated or been an error in the pipetting process. The second trial was the most successful and gave the results that were expected. The third trial was good except for the region from about 8:00-11:20 where it spiked up and down. The last 2 had more growth than the control which could mean that the cell without the gene that was knocked out is able to withstand more alcohol.
Geneticin
Protocol
analysis
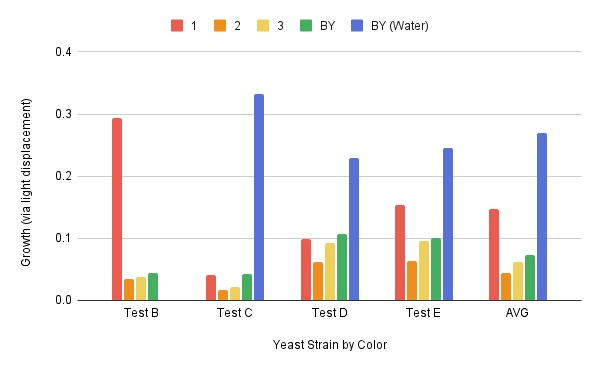
the results were pretty consistent as there were 4 similar looking results as can be seen from the graph. during the first trial, the growth was much more than expected which through off the final average however test 2-4 had similar looking results. in trial 2-4 the levels of growth matched pretty closely, YMR144W always had more growth than knockout strain 2 and 3, and was close to wild type.
Glucose Sensitivity
Protocol
Analysis
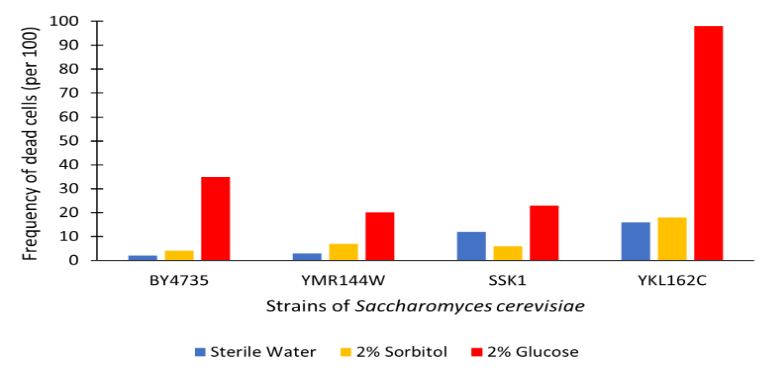
The graph displayed above shows a viability assay comparison with YMR144W knockout strain to BY4735 (wild type) and others. Results are shown as amount of dead cells per 100 assayed via hemocytometer. We found from our data that there was approximately a 15% decrease in the cell population. It was surprising to find that by removing this gene there was an increase in cell viability regarding glucose-induced apoptosis in the wild type population. Further research may be required to determine whether this resistance or lack of glucose sensitivity is linked to YMR144W for more conclusive results.
Heat Shock
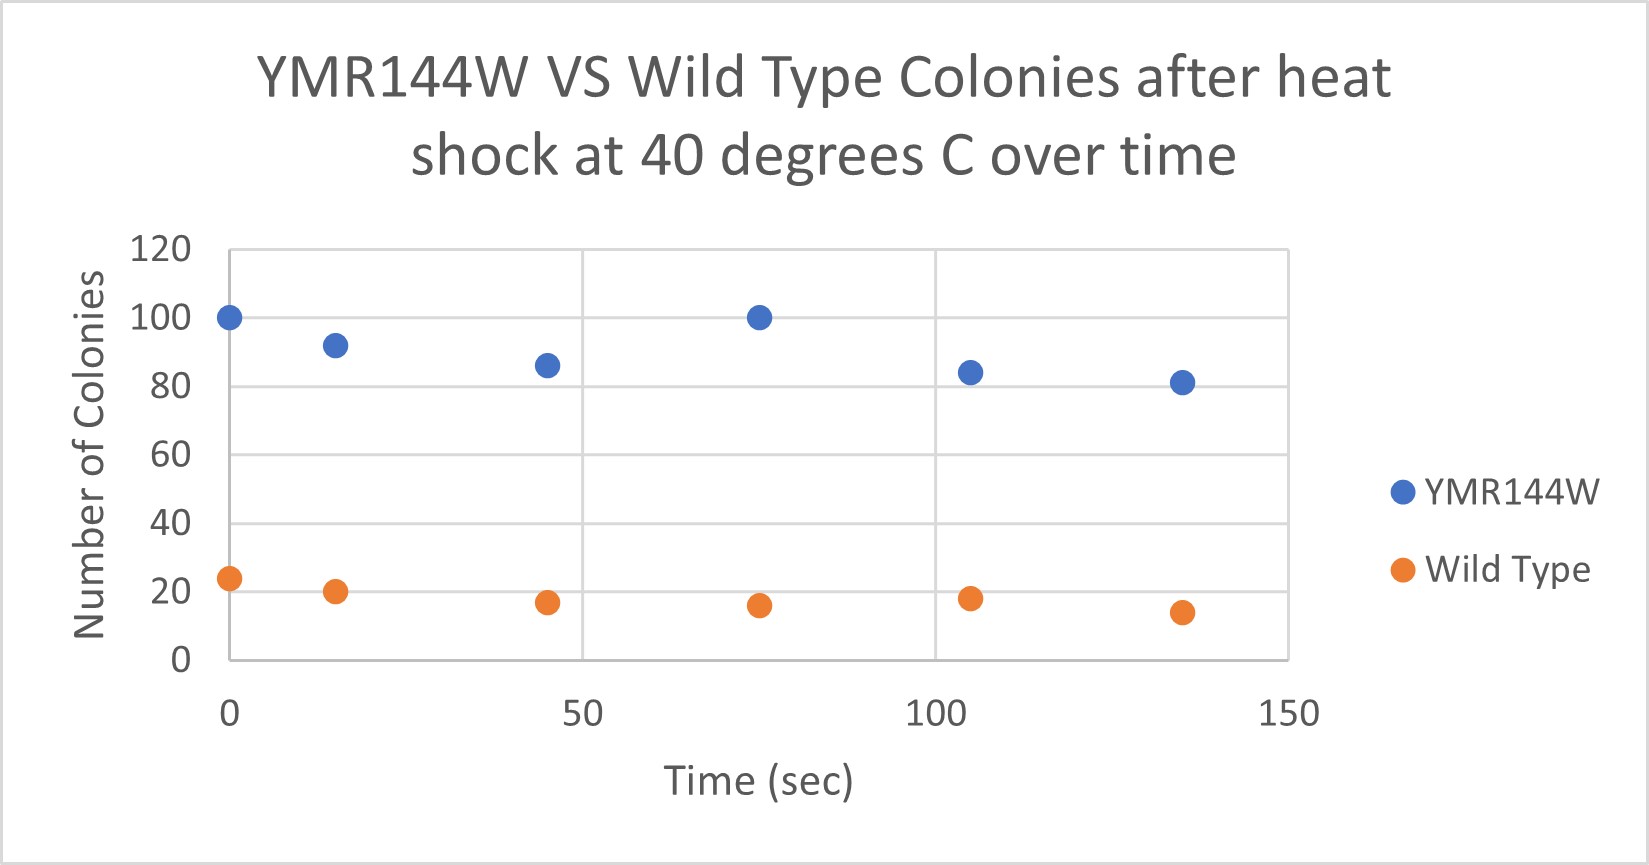
| Time (sec) | Colonies | |
|---|---|---|
| 0 | >100 | |
| 15 | 92 | |
| 45 | 86 | |
| 75 | 100 | |
| 105 | 84 | |
| 135 | 81 |
| Time (sec) | Colonies | |
|---|---|---|
| 0 | 24 | |
| 15 | 20 | |
| 45 | 17 | |
| 75 | 16 | |
| 105 | 18 | |
| 135 | 14 |
Analysis
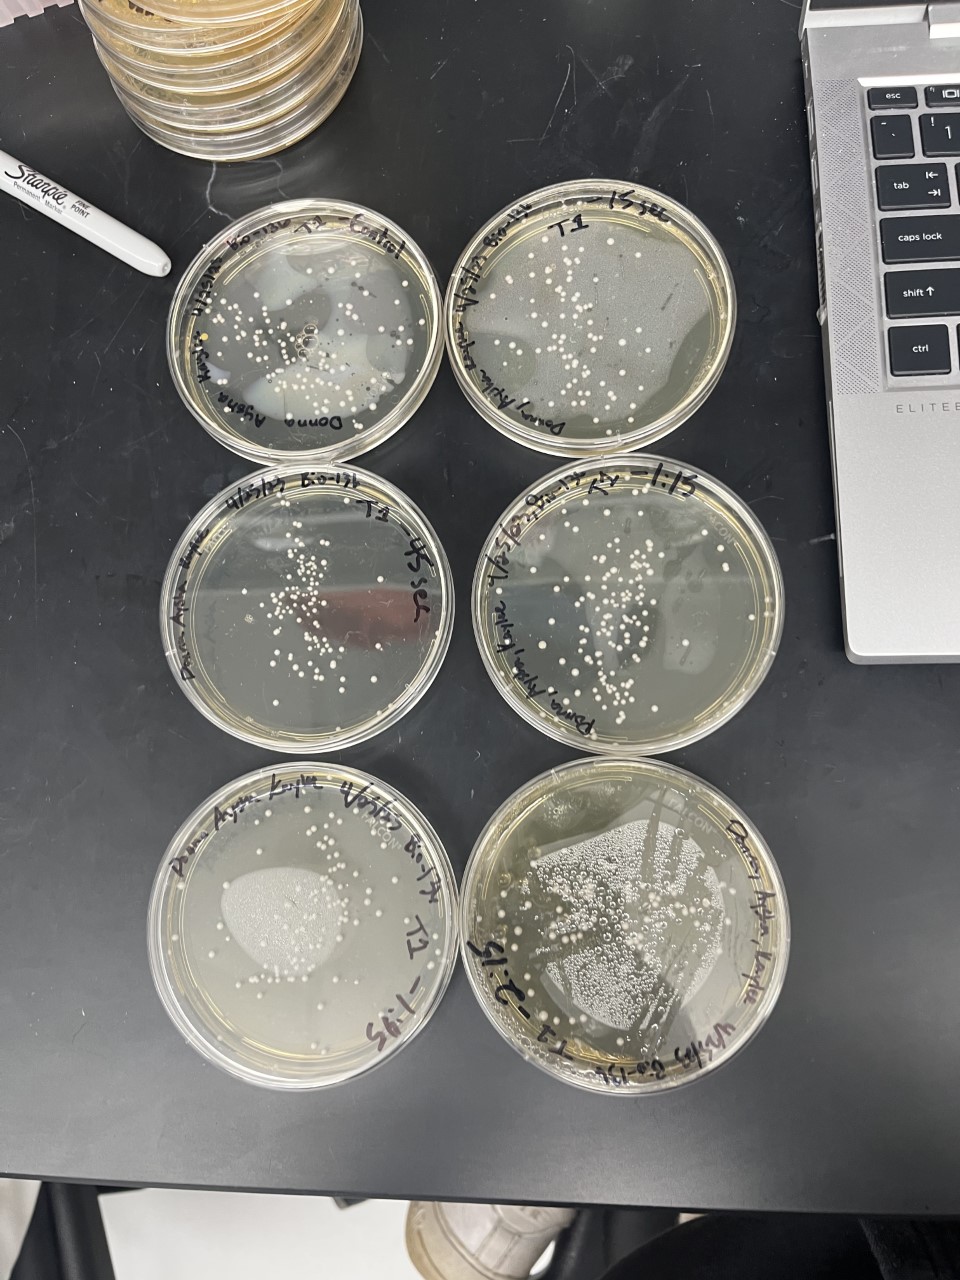
The general trend of our data yielded a negative relationship between time of heat shock. It can be inferred that with a longer amount of time we the yeast cells could continue being killed off until all of them died. Only a few of the YMR144W yeast cells died off in a matter of 135 seconds at 40 degrees Celsius. The Wild Type yeast cells were dying off at a faster rate over time compared to the YMR144W strain. This means that the gene that was knocked out in the YMR144W yeast is more senstitive to heat shock, because without that gene it is more resistant to the heat shock.
Bases
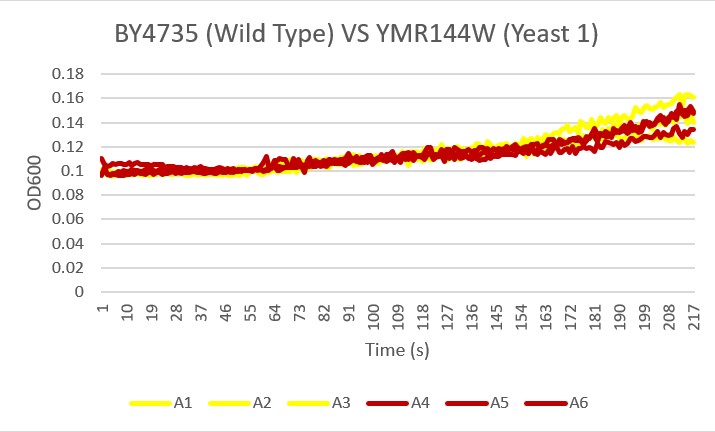
Analysis Yeast 1, A4 A5 A6, showed the most similar growth trend in the basic environment compared to the wild type yeast, A1 A2 A3 over the 24 hour reading period. This knockout did not seem to be affected by the ammonium chloride and ammonium hydroxide buffer at a pH 8.5.
Protocol- UW-Stout/Bases SP23
Electrical Shock
Protocol
Data
Analysis
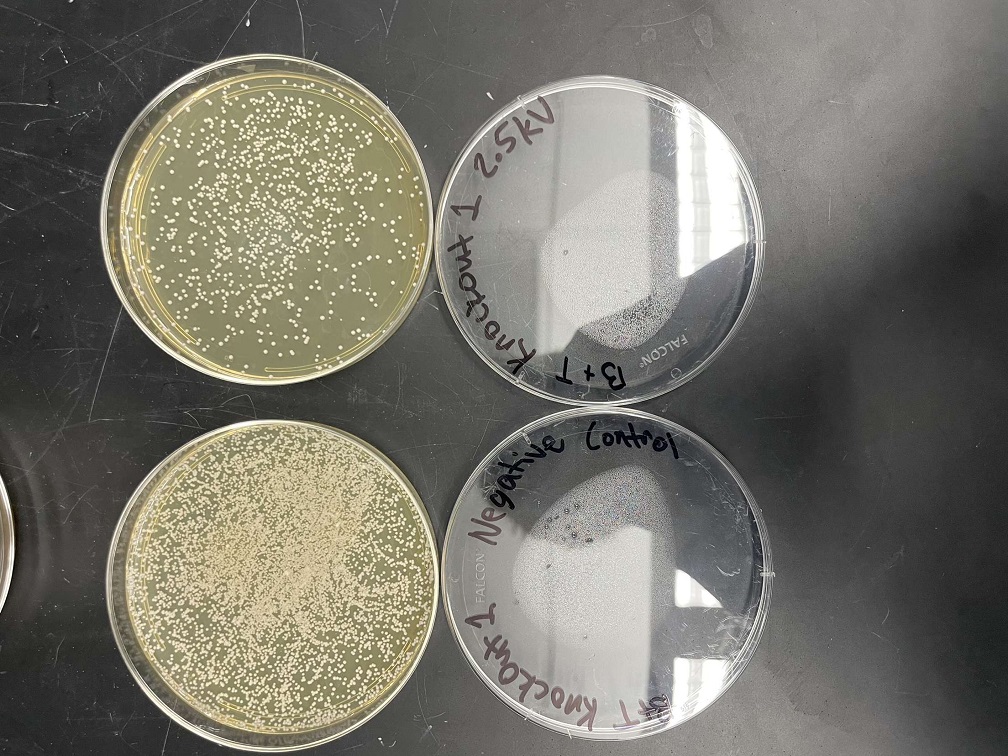
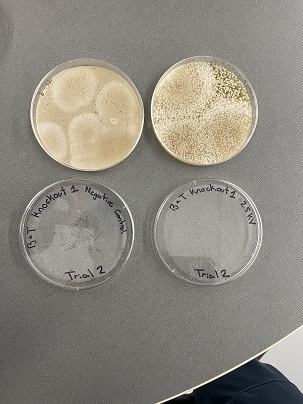
These two pictures show how the knockout strain reacts with either no electrical shock or an electrical shock of 2.5 kV. These were the same experiments but on different days to make sure things looked like each other. With this first knockout strain, we see that these acted just like our wild type cells. They show a good number of cells on our negative control, but when we shocked them at 2.5kV, many died. With our second trial we noticed that we had contamination in all of our plates. While our cells did grow so did other things.
References
See Help:References on how to add references
See Help:Categories on how to add the wiki page for this gene to a Category </protect>
