Yeast Mortimer Maps - Edition 12
The genetic and physical maps of the 16 chromosomes of Saccharomyces cerevisiae are based on data presented in the following:
- Mortimer RK and Schild D (1980) Genetic map of Saccharomyces cerevisiae. Microbiol Rev 44(4):519-71
- Mortimer RK and Schild D (1985) Genetic map of Saccharomyces cerevisiae, edition 9. Microbiol Rev 49(3):181-213
- Mortimer RK, et al. (1989) Genetic map of Saccharomyces cerevisiae, edition 10. Yeast 5(5):321-403. PMID: 2678811.
- Mortimer RK, et al. (1992) Genetic and physical maps of Saccharomyces cerevisiae, Edition 11. Yeast 8: 817-902.
Physical maps were compiled from:
- Riles L, et al. (1993) Physical maps of the six smallest chromosomes of Saccharomyces cerevisiae at a resolution of 2.6 kilobase pairs. Genetics 134(1):81-150
- gene/clone associations reported by many laboratories
- DNA consensus sequences produced by Fred Dietrich from GenBank sequences,
- the seven completed yeast chromosomal sequences: I, II, III, V, VIII, IX, and XI (Bussey et al., (1994); Feldmann et al, (1994), EMBL J. in press; Oliver et al. (1992), Nature 357:38-46; Dietrich et al., (1994); Johnston et al., (1994), Science 265:2077-2082 Barrell et al., (1994); Dujon et al. (1994), Nature 369:371-378). Full text of these papers is available here.
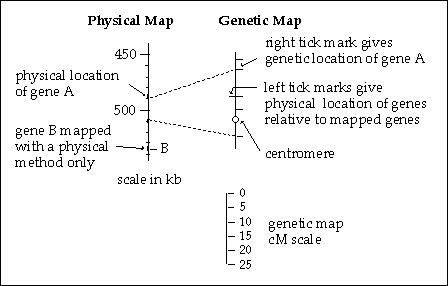
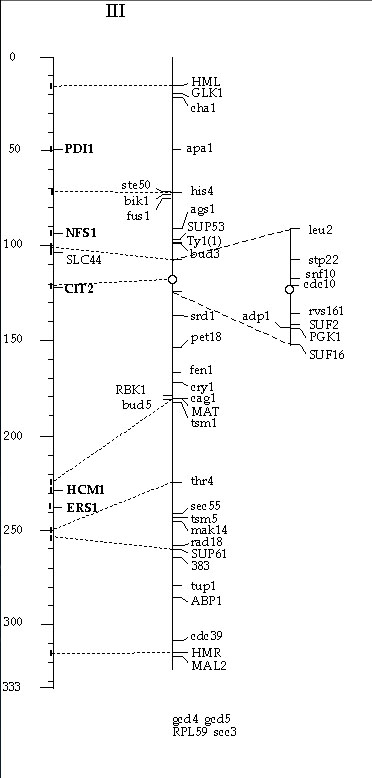
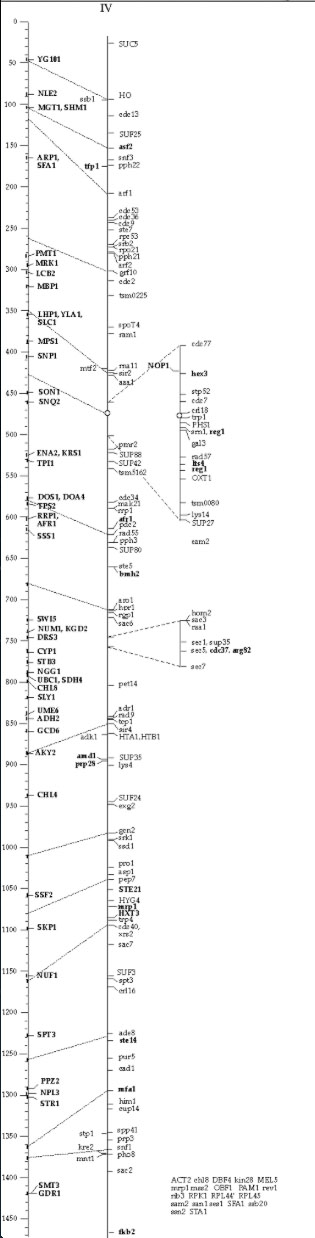
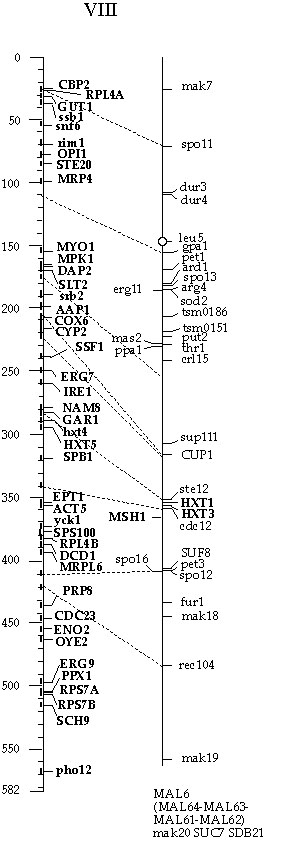
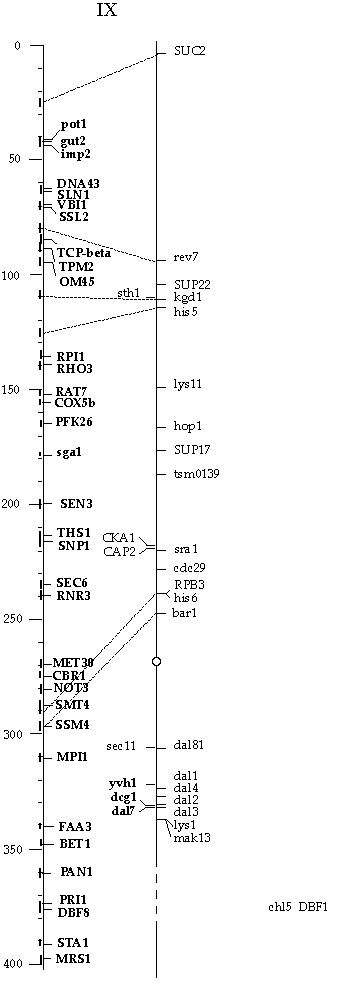
Genetic maps are drawn as follows:
- Solid vertical lines.
- Dashed lines represent linkages established by mitotic crossing over.
- Centromeres are represented as circles with the left arm above and the right arm below the centromere.
- Horizontal tick marks indicate the positions of the genes.
- Crowded regions on the genetic map are drawn as expansions; tick marks are joined to the gene symbol by a thin connecting line.
- Genes added since Edition 11 are in bold type.
- Genes that have been mapped on the basis of sequence overlap relative to genetically-mapped genes are positioned to the left of the genetic map line and are connected to this line by tick marks.
- When the order of these genes relative to the mapped genes is unknown, they are arbitrarily placed distal to the mapped gene.
Physical maps are drawn as follows:
- Parallel and to the left of the genetic maps, with the scale (in kb) to the left of this line.
- Symbols represent genes located solely by physical methods.
- Note that two loci (RDN1 on XII and CUP1 on VIII are known to vary greatly in length from strain to strain.
- Dashed lines connect the same gene on the genetic and physical maps, only a fraction of such associations are shown.
Other information of note:
- Genes listed below the chromosome maps or expanded regions of these maps have been assigned to the chromosome or region either by genetic or physical methods but have not been positioned more precisely.
- Some gene symbols in this category are capitalized; this does not necessarily indicate dominance but instead means that the wild type copy was used to map the gene.
- Numerous gene name synonyms have not been included.
- The choice of symbol was guided by an amalgam of consensus, literature usage, clarity relative to function, and priority in the literature.
- Many of the physical map gene positions are based on hybridization results to the prime clone filter grids.
- In these cases the location of the gene is arbitarily placed at the center of the hybridizing region.
Maps of individual chromosomes are found below, click on an individual chromosome to view its larger map image.
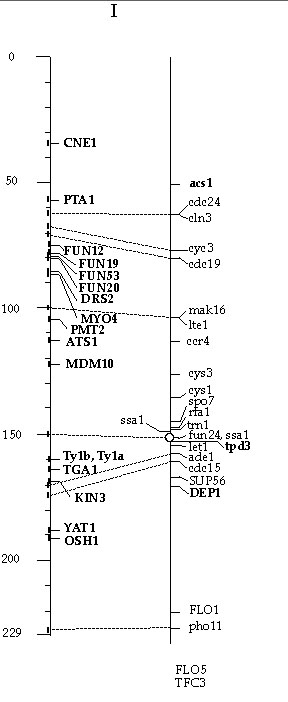 Chromosome I Chromosome I |
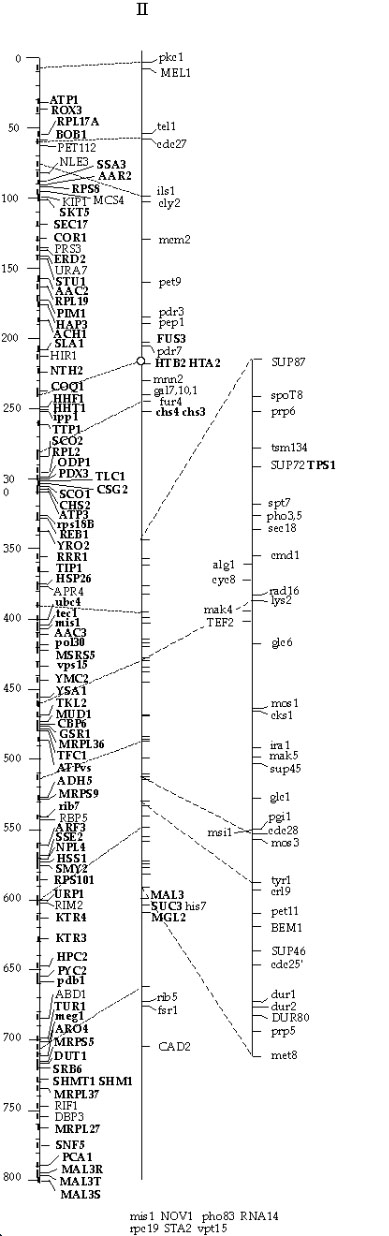 Chromosome II Chromosome II |
 Chromosome III Chromosome III |
 Chromosome IV Chromosome IV |
 Chromosome V Chromosome V |
 Chromosome VI Chromosome VI |
 Chromosome VII Chromosome VII |
 Chromosome VIII Chromosome VIII
|
 Chromosome IX Chromosome IX |
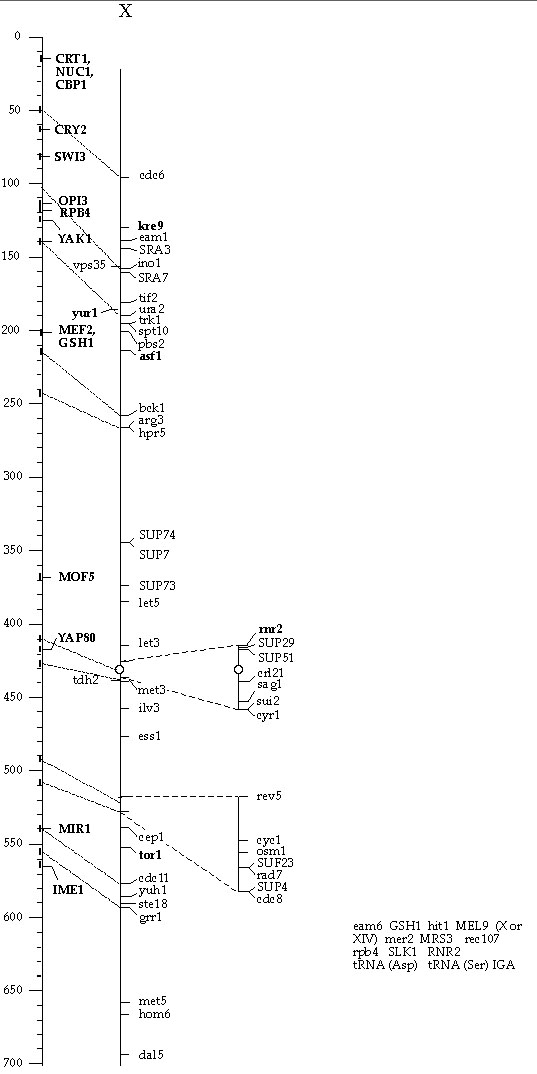 Chromosome X Chromosome X |
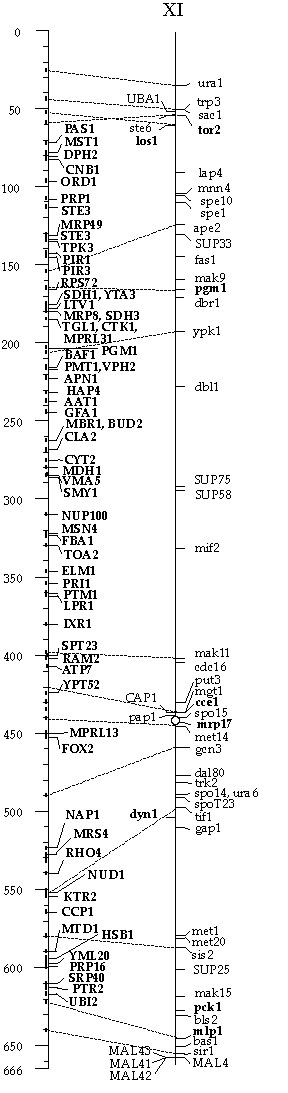 Chromosome XI Chromosome XI |
 Chromosome XII Chromosome XII |
 Chromosome XIII Chromosome XIII |
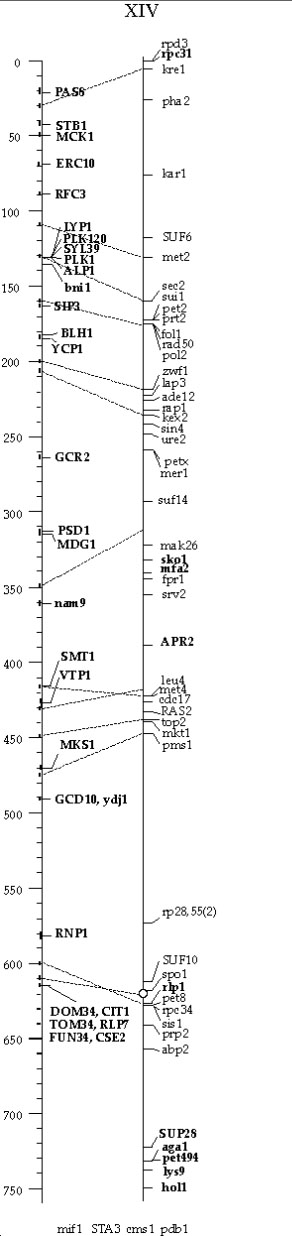 Chromosome XIV Chromosome XIV |
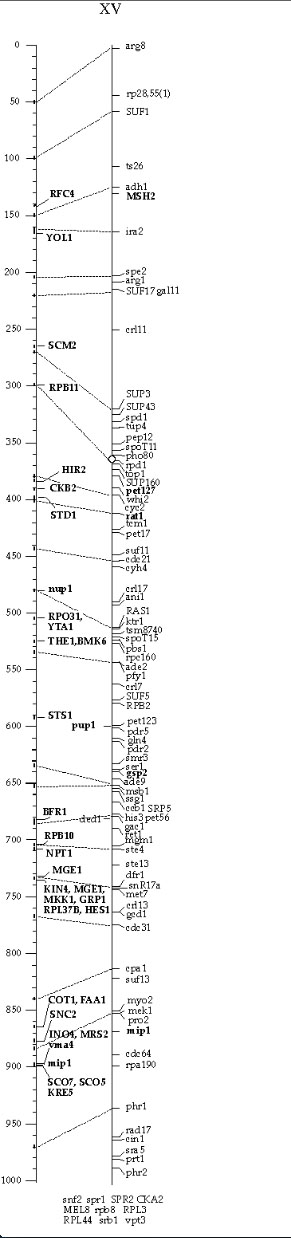 Chromosome XV Chromosome XV |
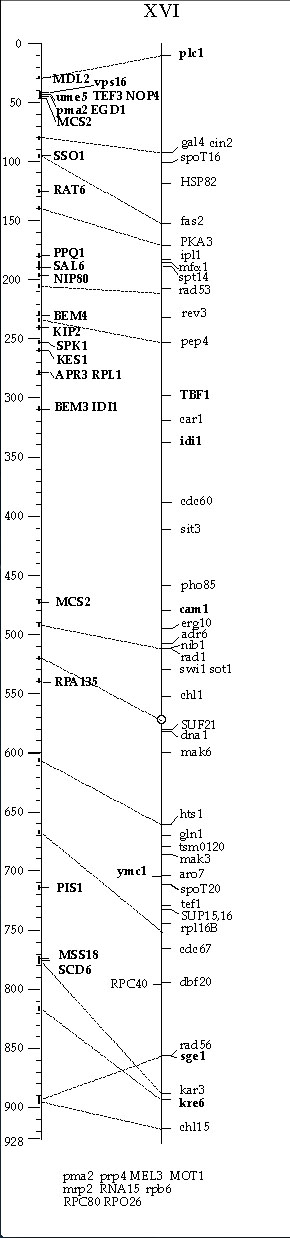 Chromosome XVI Chromosome XVI
|