Meiotic Double-Stranded Breaks in the Yeast Genome
The localization of the Spo11-dependent double-stranded break sites and the chromatin asssociation of Mre11p with double strand break sites during meiosis has been characterized at the genome-wide level in a subsequent paper (Borde et al. (2004) Association of Mre11p with Double-Strand Break Sites during Yeast Meiosis. Mol Cell 13(3):389-401).
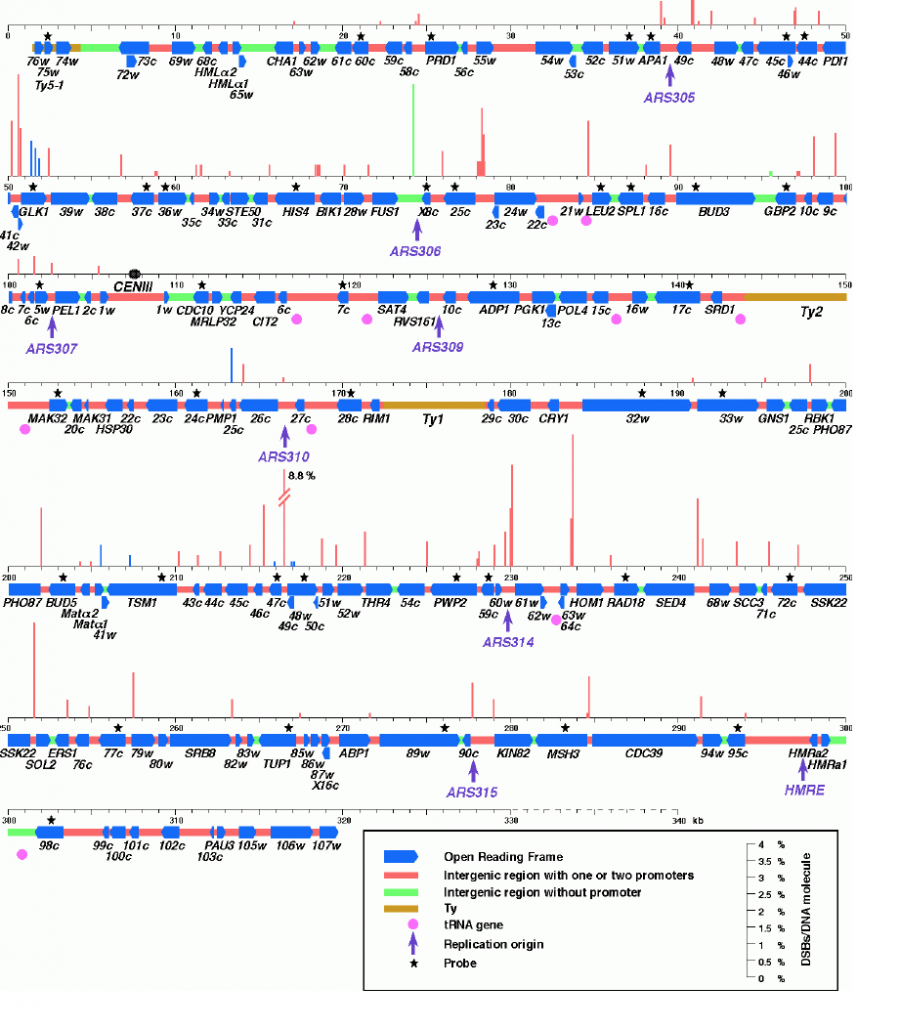
The meiotic double-stranded breaks data on Chromosome III was kindly provided in both tabular and graphical form by Dr. Frédéric Baudat and Dr. Alain Nicolas of the Institut Curie, Section de Recherche. For further information, please see their paper, Proc. Natl. Acad. Sci. USA 94:5213-5218 (1997). This graphic represents Figure 2 of this paper. The key and legend for this figure are located directly under the figure.
For a commentary article on this topic, please see Nicolas, A. (1998). Relationship between transcription and initiation of meiotic recombination: Toward chromatin accessibility. Proc. Natl. Acad. Sci. USA 95:87-89 (1998).

Legend from Figure 2 of Proc. Natl. Acad. Sci. USA 94:5213-5218 (1997):
Location and amount of meiotic DSBs on chromosome III. For simplification, the ORF numbers (22) are indicated without YCL or YCR. The physical map is drawn to scale from the sequence (coordinates are in kb) and is corrected for the major differences found in ORD1181 derived from SK1 that lead chromosome III to a length of 340 kb instead of 315 kb in the published sequence (22): Ty2-17 near LEU2 is absent, as is the delta LTR between YCR6c and YCR7c; a Ty2 identified by PCR amplification and restriction analysis is inserted at coordinate 151,000; a Ty1 is inserted between RIM1 and YCR29c (25); additional 396 bp are in YCR89w; the right chromosomal end is 15-25 kb longer and of unknown sequence. Bar height represents the percent of meiotic DSBs per DNA molecule. Generally, two measurements were made at each region, with different restriction digests and probes. Standard errors between different measurements of the same DSB sites depend on the DSB frequencies: 0.05-0.2% for DSB 0.5%, 0.2-0.5% for DSB between 0.5% and 1.5%, and 0.5-1% for DSB > 1.5%. Red, green, and blue bars represent DSBs in intergenic-promoter, intergenic terminators, and coding regions, respectively. Other information is provided in the legend box.