Difference between revisions of "UW-Stout/Saline SP23"
(→Results) |
|||
| (66 intermediate revisions by the same user not shown) | |||
| Line 1: | Line 1: | ||
| − | ''' | + | |
| + | == '''Pilot Experiment''' == | ||
| − | == | + | === Introduction === |
| − | |||
| − | |||
| − | |||
This experiment is testing how much salt will stress out the yeast without killing them. Our goal of this experiment is to see how much salt is needed to allow the yeast to grow while altering their growth curve without killing them. In this pilot experiment we tested wild yeast strains against different molarities of salt water. Looking at the growth curve data will help us determine which molarity of salt water stressed out the yeast without killing them. | This experiment is testing how much salt will stress out the yeast without killing them. Our goal of this experiment is to see how much salt is needed to allow the yeast to grow while altering their growth curve without killing them. In this pilot experiment we tested wild yeast strains against different molarities of salt water. Looking at the growth curve data will help us determine which molarity of salt water stressed out the yeast without killing them. | ||
| − | + | === Materials === | |
| − | |||
*H2O | *H2O | ||
*NaCl (table salt) | *NaCl (table salt) | ||
*12 2 ml centrifuge tubes | *12 2 ml centrifuge tubes | ||
*Yeast cells | *Yeast cells | ||
| + | === Procedure === | ||
| + | Using the calculation table that is provided, calculate the dilution from 4 M saltwater into the varying amounts.([https://word-edit.officeapps.live.com/we/WordViewer/request.pdf?WOPIsrc=https%3A%2F%2Fliveuwstout%2Dmy%2Esharepoint%2Ecom%2Fpersonal%2Frobertse3001%5Fmy%5Fuwstout%5Fedu%2F%5Fvti%5Fbin%2Fwopi%2Eashx%2Ffiles%2F8c1d9eaa693e4e718d34a8e4cc7861e4&access_token=eyJ0eXAiOiJKV1QiLCJhbGciOiJSUzI1NiIsIng1dCI6IkNRQU5lRWUtSUxVNTdlSnRZS0N2QVh2b1RkNCJ9.eyJhdWQiOiJ3b3BpL2xpdmV1d3N0b3V0LW15LnNoYXJlcG9pbnQuY29tQGI3MWE4MWEzLTJmOTUtNDM4MS05Yjg5LWM2MjM0M2E2NjA1MiIsImlzcyI6IjAwMDAwMDAzLTAwMDAtMGZmMS1jZTAwLTAwMDAwMDAwMDAwMEA5MDE0MDEyMi04NTE2LTExZTEtOGVmZi00OTMwNDkyNDAxOWIiLCJuYmYiOiIxNjgzNDE2ODQ2IiwiZXhwIjoiMTY4MzQ1Mjg0NiIsIm5hbWVpZCI6IjAjLmZ8bWVtYmVyc2hpcHxyb2JlcnRzZTMwMDFAbXkudXdzdG91dC5lZHUiLCJuaWkiOiJtaWNyb3NvZnQuc2hhcmVwb2ludCIsImlzdXNlciI6InRydWUiLCJjYWNoZWtleSI6IjBoLmZ8bWVtYmVyc2hpcHwxMDAzMjAwMTllMTFlMTljQGxpdmUuY29tIiwic2hhcmluZ2lkIjoiOTk0YjNhMjEtMjYwYy00ZWI5LWE0OWEtNWM5NjdhMGIzMjJkIiwic2lnbmluX3N0YXRlIjoiW1wia21zaVwiLFwiZHZjX2NtcFwiXSIsInV0aSI6IlJsbHNZUGlzNDBpWV9PMXFnblZJQUEiLCJpc2xvb3BiYWNrIjoiVHJ1ZSIsImFwcGN0eCI6IjhjMWQ5ZWFhNjkzZTRlNzE4ZDM0YThlNGNjNzg2MWU0O3ZYam1GZUVqbHNqeE0xWnkzMU9mRVZpSkFFMD07RGVmYXVsdDs7N0ZGRkZGRkZGRkZGRkZGRjtUcnVlOzs7MTA0ODY0NDszNjVhYjBhMC02MDYwLTMwMDAtOGU0Zi0wNTdjNDk0NzlhZmIiLCJmaWQiOiIxOTI5NjUifQ.dVxwv_0zx2Sxo31QbJxRZHhQBYTadHamgTzitKBqK7XEFgZFxXojwAmlWFFmY2DLP1fpthWE-MV2I2VT6uU9wnL6qN30U5UqSwHA1n5FiwMI2YxawseBMY3t72Z7pSYmzmXV7qZsOzefc7-ihcHbyef2h_KywR0-mvJSPM6XEwu5W6fNlHjMIXHDX93hSQb1FW7aahrrDS6j_wy9JPSEjavSnDi05Np8SOSqzA4e5cw7_DUsyYdEgYARPHP_vYdDTUcN2R5dvdrAu_z2A8Z_PI_JWGuPJZvFrr3TbJ-hQiegcO3X5CXleegozpdyz5QzL0MZ6xVAWWLY5WTyFe9neA&access_token_ttl=1683452849737&type=downloadpdf&rndm=a40d1917-ce50-465c-b734-a1a75c4f0e20&usid=778a8f4f-3b6d-4079-a331-cfa2345b9fdd&build=16.0.16502.41004&waccluster=PUS3 concentration table]) | ||
| + | #Make these solutions in each of the 12 2 ml centrifuge tubes | ||
| + | #Micropipette 50 ul of yeast cells into 12 different wells | ||
| + | #Micropipette 50 ul of the differing saltwater solutions into each well | ||
| + | #Put into plate reader for 24-48 hours | ||
| + | === Data=== | ||
| + | |||
| + | |||
| + | [[File:data_1-jpeg%22.jpeg#file]] | ||
| + | === Results=== | ||
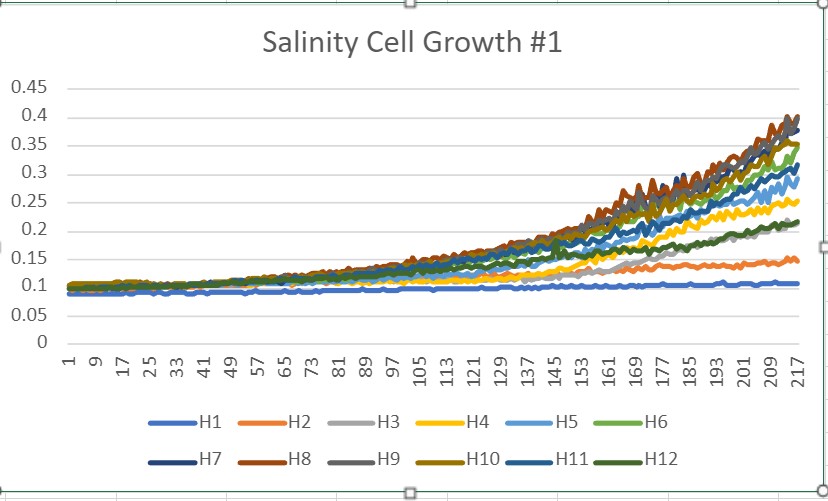
| + | The graph above shows the growth of our yeast that was mixed with all the different salinity solutions. You can see in the graph that the low salinity solutions didn't really have an effect on the yeast growth. But all the higher salinity solutions had too much of an effect on the yeast. So, with that information, we decided to go with the 2 M concentration because it stressed out the yeast without killing them. | ||
| + | |||
| + | == '''Final experiment''' == | ||
| + | |||
| + | |||
| + | === Introduction === | ||
| + | After we found that the 2 M concentration, stresses out the yeast enough to where it doesn't kill them, we will use that salinity concentration and test it out on different strains of yeast. Each of the strains of yeast that we are testing our experiment on, has a different gene that has been knocked out. Our goal for this experiment is to see how our salinity concentration will affect each of the strands of yeast. We will also be testing this experiment on a wild type of yeast. After we test all the strands of yeast, the wild type and the specific ones, we will compare the data. When we compare the data, we are looking to see if our salinity concentration had any effect on the yeast cells. | ||
| + | === Materials === | ||
| + | *NaCl (table salt) | ||
| + | *2 M saltwater | ||
| + | *micropipettes | ||
| + | *Yeast cells (wild, 1, 2, & 3) | ||
| + | *Microwell plate | ||
| + | === Procedure === | ||
| + | #Obtain a sample of 2 M saltwater. | ||
| + | #Obtain the yeast cells | ||
| + | #Pick a row in the microwell plate and micropipette 50 ul of 2 M saltwater into the first four wells of the row. | ||
| + | #Micropipette 50 ul of each of the yeast cells into the wells with the saltwater. | ||
| + | #Record where you put each sample. | ||
| + | #Put into plate reader for 18-24 hours. | ||
| + | #Obtain results from plate reader and calculate the doubling rate. | ||
| + | === Data === | ||
| + | [[File:Saltwatertorture.jpg]] | ||
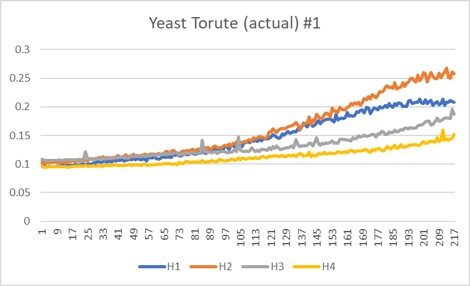
| − | + | These are the various different yeast strains that were experimented on. H1 is the wild type gene, H2 is the YMR144W, H3 is SSK1, and H4 is YKL162C. | |
| − | |||
| − | + | === Results === | |
| + | The graph above showing the different yeast strains showed an interesting result. The results that were obtained were tested multiple times to prove its' worth and credibility. From the data that was collected, we were able to conclude that the H2 strain (YMR144W) had a much higher production rate than that of the others in 2M saltwater. The strain with least resistance to the torture was H4 (YKL162C), showing a much less production rate than the others. | ||
Latest revision as of 18:35, 8 May 2023
Contents
Pilot Experiment
Introduction
This experiment is testing how much salt will stress out the yeast without killing them. Our goal of this experiment is to see how much salt is needed to allow the yeast to grow while altering their growth curve without killing them. In this pilot experiment we tested wild yeast strains against different molarities of salt water. Looking at the growth curve data will help us determine which molarity of salt water stressed out the yeast without killing them.
Materials
- H2O
- NaCl (table salt)
- 12 2 ml centrifuge tubes
- Yeast cells
Procedure
Using the calculation table that is provided, calculate the dilution from 4 M saltwater into the varying amounts.(concentration table)
- Make these solutions in each of the 12 2 ml centrifuge tubes
- Micropipette 50 ul of yeast cells into 12 different wells
- Micropipette 50 ul of the differing saltwater solutions into each well
- Put into plate reader for 24-48 hours
Data
Results
The graph above shows the growth of our yeast that was mixed with all the different salinity solutions. You can see in the graph that the low salinity solutions didn't really have an effect on the yeast growth. But all the higher salinity solutions had too much of an effect on the yeast. So, with that information, we decided to go with the 2 M concentration because it stressed out the yeast without killing them.
Final experiment
Introduction
After we found that the 2 M concentration, stresses out the yeast enough to where it doesn't kill them, we will use that salinity concentration and test it out on different strains of yeast. Each of the strains of yeast that we are testing our experiment on, has a different gene that has been knocked out. Our goal for this experiment is to see how our salinity concentration will affect each of the strands of yeast. We will also be testing this experiment on a wild type of yeast. After we test all the strands of yeast, the wild type and the specific ones, we will compare the data. When we compare the data, we are looking to see if our salinity concentration had any effect on the yeast cells.
Materials
- NaCl (table salt)
- 2 M saltwater
- micropipettes
- Yeast cells (wild, 1, 2, & 3)
- Microwell plate
Procedure
- Obtain a sample of 2 M saltwater.
- Obtain the yeast cells
- Pick a row in the microwell plate and micropipette 50 ul of 2 M saltwater into the first four wells of the row.
- Micropipette 50 ul of each of the yeast cells into the wells with the saltwater.
- Record where you put each sample.
- Put into plate reader for 18-24 hours.
- Obtain results from plate reader and calculate the doubling rate.
Data
These are the various different yeast strains that were experimented on. H1 is the wild type gene, H2 is the YMR144W, H3 is SSK1, and H4 is YKL162C.
Results
The graph above showing the different yeast strains showed an interesting result. The results that were obtained were tested multiple times to prove its' worth and credibility. From the data that was collected, we were able to conclude that the H2 strain (YMR144W) had a much higher production rate than that of the others in 2M saltwater. The strain with least resistance to the torture was H4 (YKL162C), showing a much less production rate than the others.

